.webp)
It’s essential that your eCommerce platform provides the data and insight you need to make confident, informed decisions.
That’s why we’ve invested heavily in Venditan Commerce’s reporting capabilities over the years, building out more than 100 reports spanning sales, stock, customers and beyond.
In this article, we’ll take a closer look at six of the most commonly used reports — how they work, what you can configure, and the real value they deliver for your business.
(For a full list of available reports, head over to our documentation.)
Group Sales Analysis Report
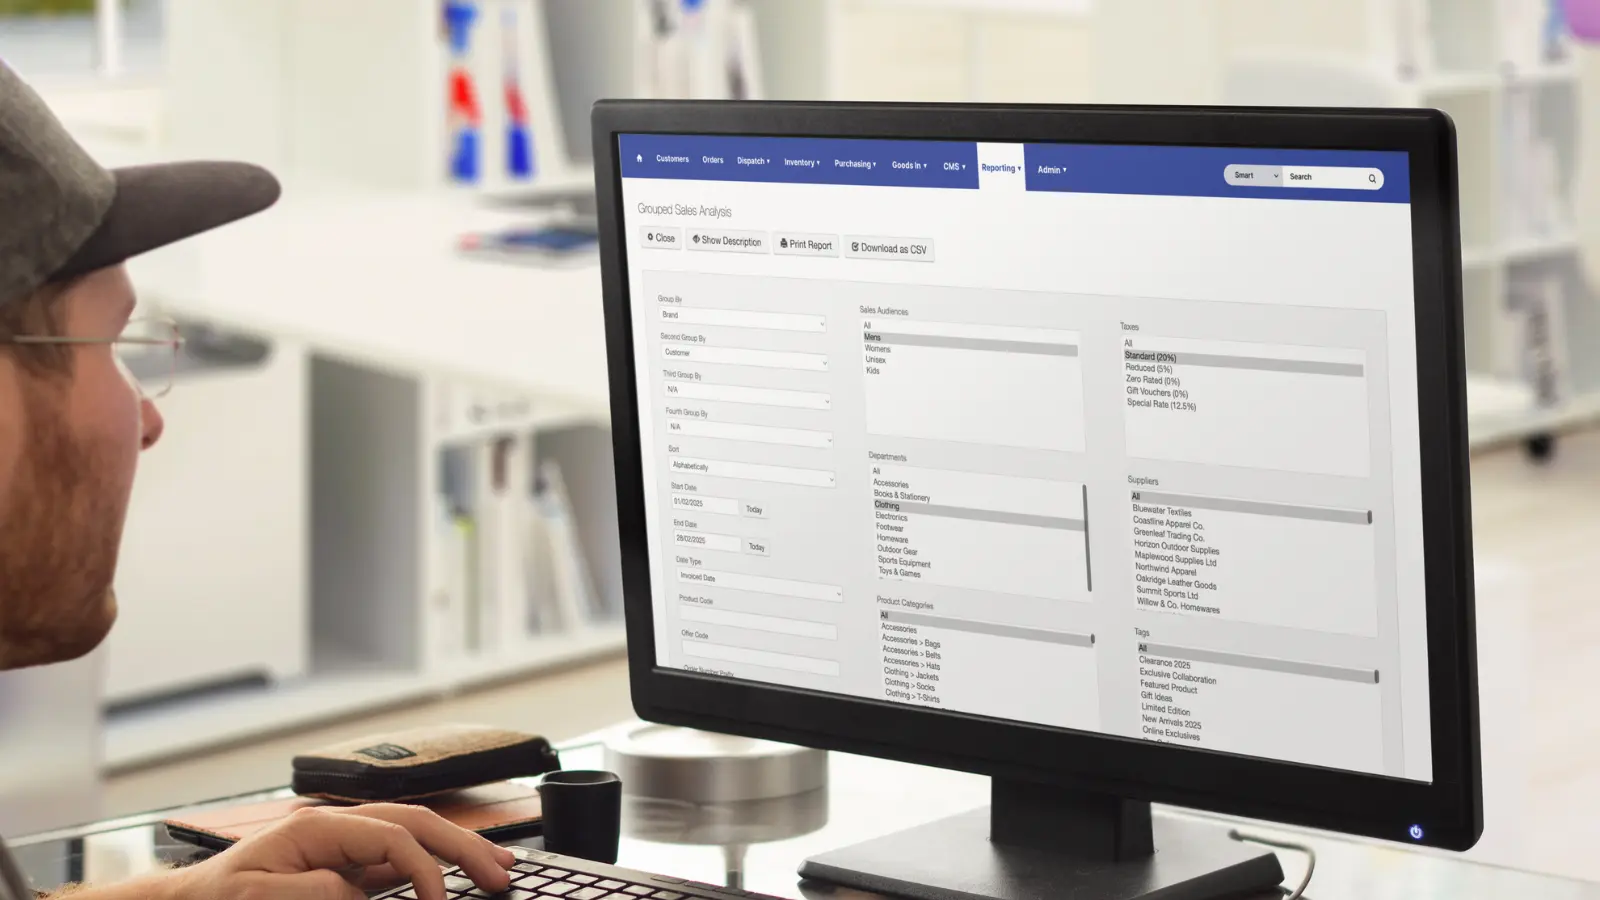
The Group Sales Analysis Report in Venditan Commerce gives you the ability to quickly organise and interrogate your sales data in a way that is relevant to your business.
You can group sales by Brand, Customer, Customer Type, Sales Channel, or Product. The grouped data can then be refined further using filters such as Sales Audience, Sales Channel, Department, Product Category, Tax Rate, Supplier, Payment Type, or Payment Date.
You can also set a Start and End Date, compare Date Ranges, and choose whether to include or exclude sales from physical stores.
For example, you might group sales by Brand, filter to Online Channels only, and compare this year’s figures to last year’s for the same Date Range.
Or, you could group by Customer Type and filter to a specific Department to see which products are performing best with Trade versus Retail Customers.
The report generates detailed metrics including Items Sold, Totals, Taxes, Profit, Margin, and Available Stock, all broken down item-by-item.
Having this level of insight means you can quickly identify high-margin lines, understand seasonal trends, monitor the performance of Sales Channels, and make data-backed purchasing and marketing decisions. If you operate across multiple channels, it gives you a single, reliable view of performance without having to piece together data from different sources.
Stock Take Report
The Stock Take Report gives you a clear and up-to-date breakdown of your stock levels across all locations at the moment you run it. Whether you manage one store or multiple warehouses, it provides a snapshot that lets you see exactly what you have, where it is, and in what quantity.
You can filter the report to focus on what matters most to you, such as a specific Sales Channel (Website, Marketplace, or Physical Store), Brand, Department, Product Category, Supplier, or even down to a specific Location or Bin. This makes it quick to isolate the part of your inventory you want to review, whether that’s seasonal products, a key brand, or stock from a particular supplier.
The report generates useful product identifiers such as Product Code, Title, and Barcode, alongside detailed stock metrics including Available Stock, Allocated Stock, and Counted Stock. You can also see cost values for available and allocated items, helping you understand the financial value of your stock on hand.
With this report, you can plan replenishment more effectively, identify any discrepancies between system records and physical counts, and ensure your most valuable inventory is in the right place at the right time. It’s a vital tool for accurate inventory management, whether you’re doing a full stock take or just spot-checking specific products.
Inventory Valuation Breakdown Report
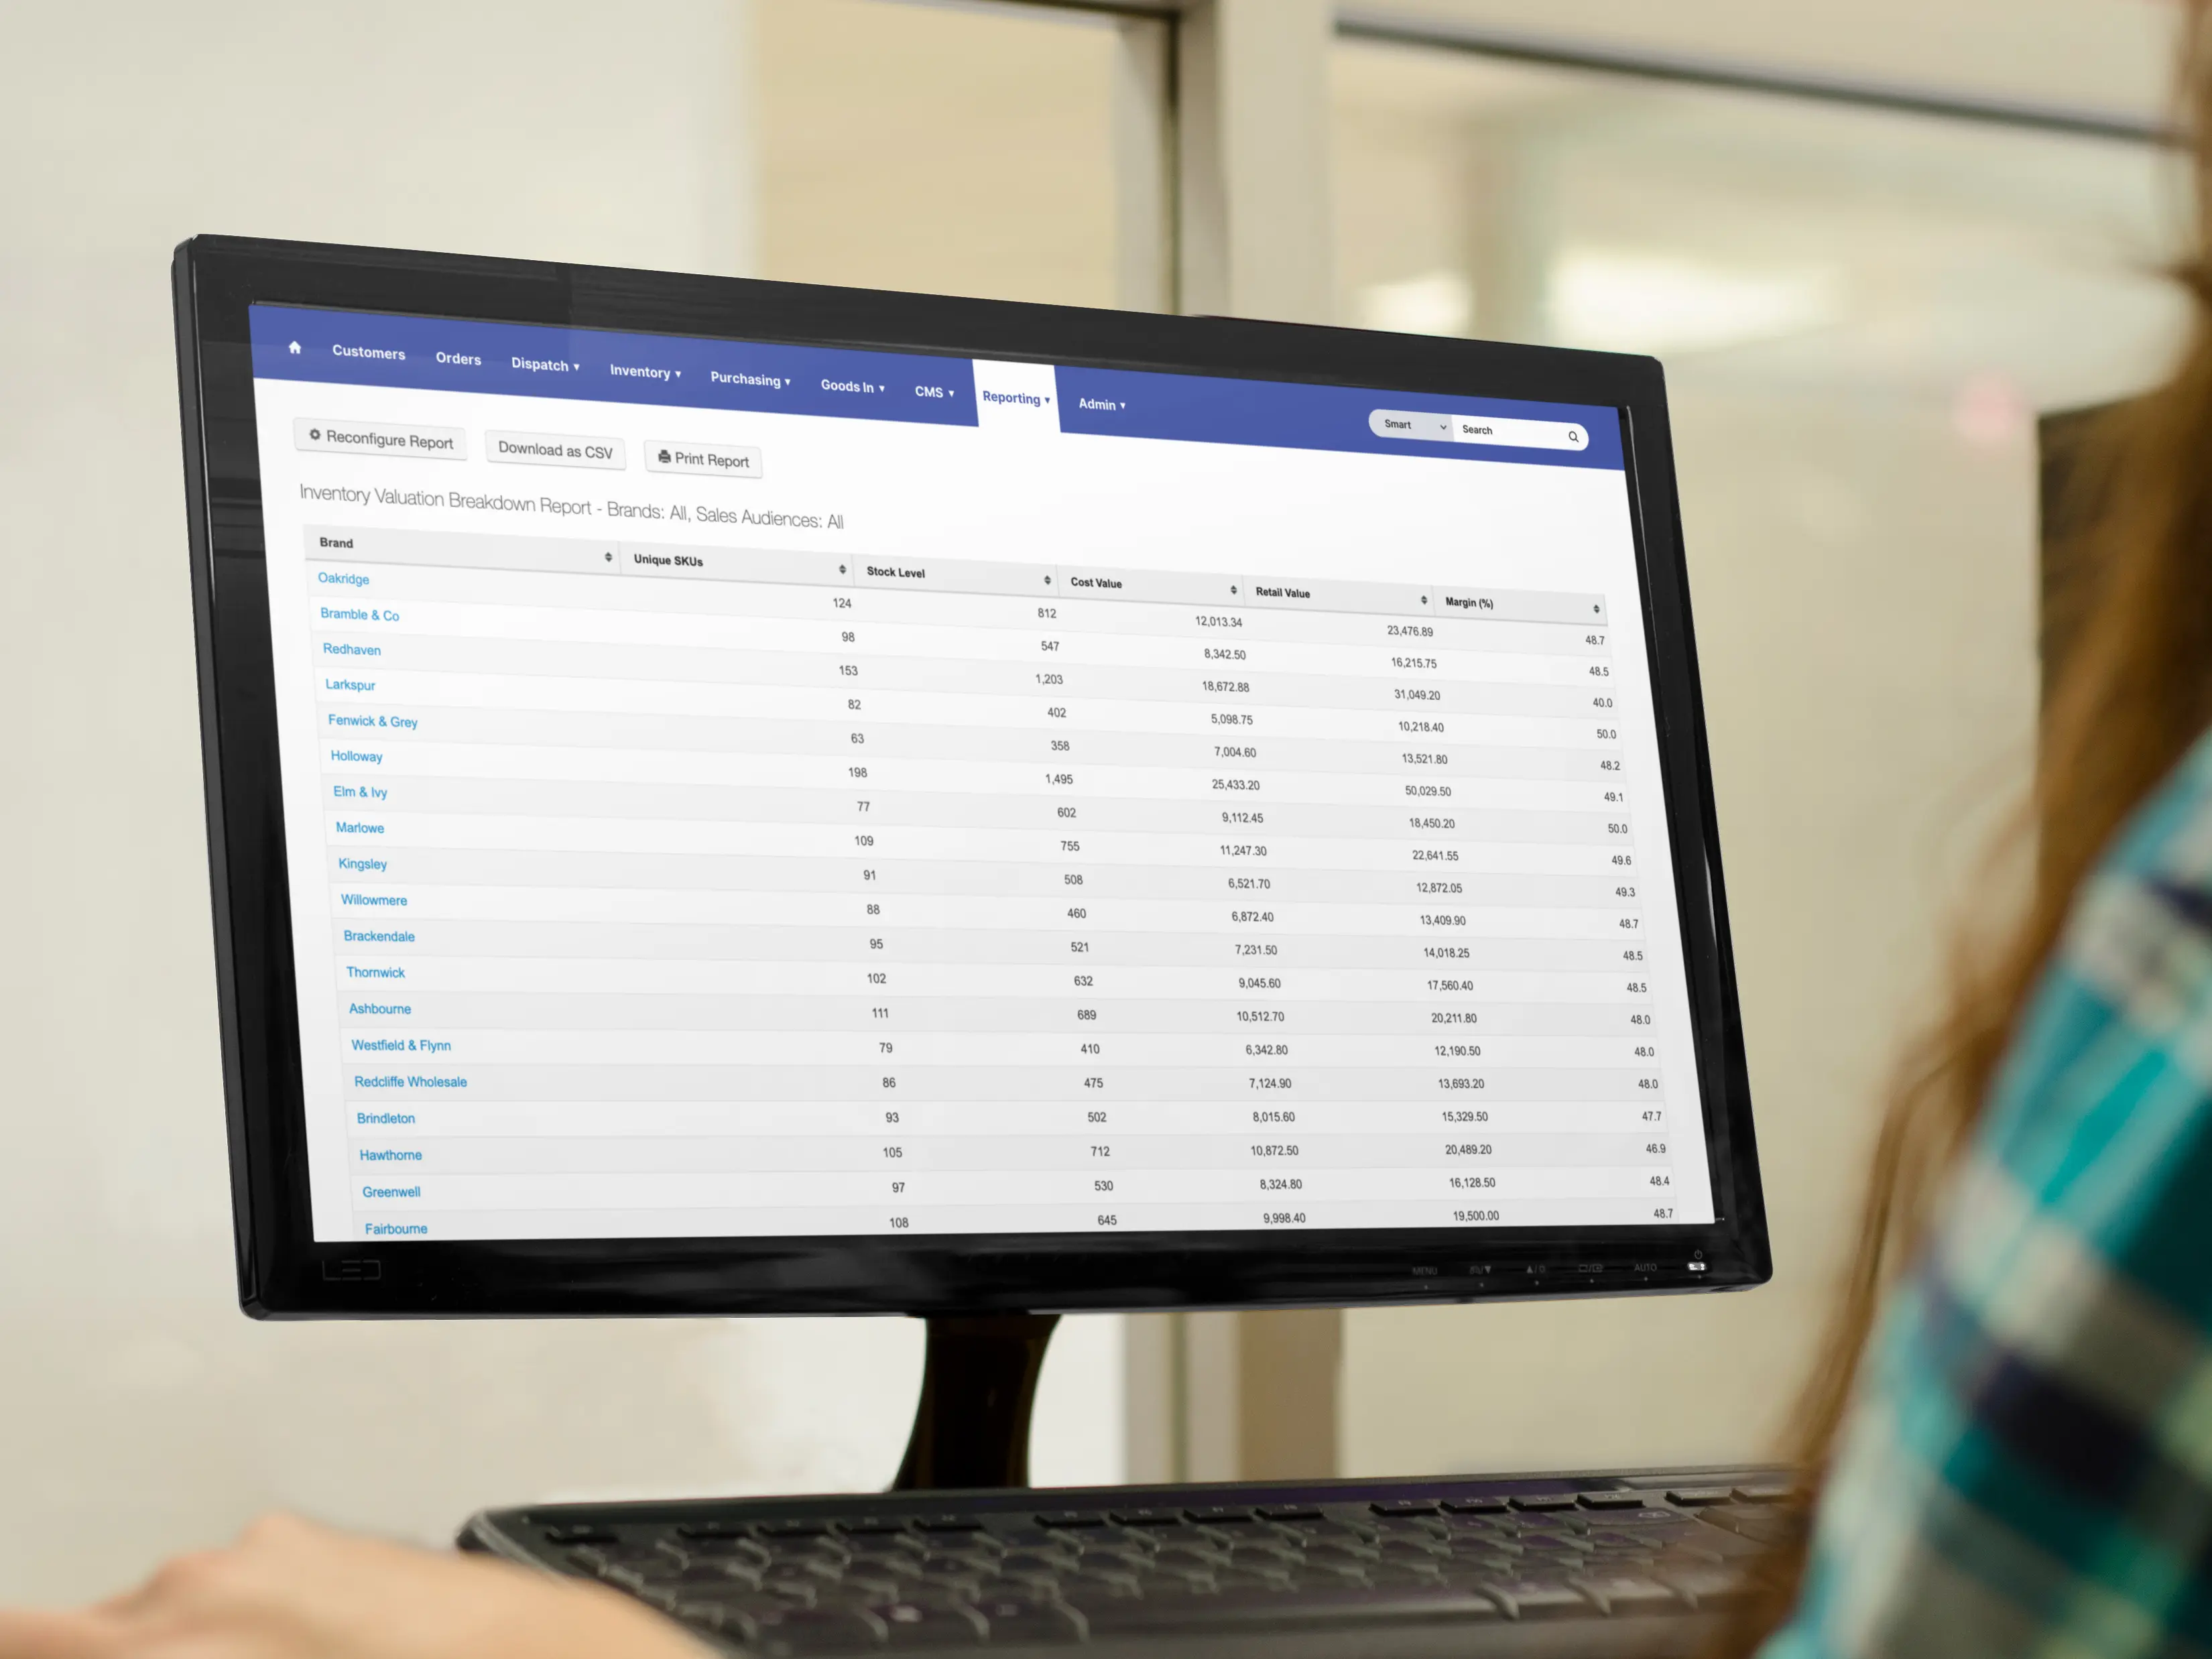
The Inventory Valuation Breakdown Report gives you a clear view of the value of your unsold stock for a specific Store or Location. It’s an at-a-glance way to understand the cost and retail value of what’s sitting in your inventory, along with the margin it represents.
You can filter the report to focus on the stock that matters most, for example, by Brand, Supplier, Season, Department, Product Category, or Sales Audience. This makes it easy to drill down into particular ranges or suppliers, or to analyse slow-moving stock that may need promotional attention.
The report provides key details such as the number of unique SKUs, current stock levels, total cost value, total retail value, and calculated margin. By combining these figures, you can make better-informed decisions about purchasing, discounting, or reallocating stock across your locations.
Whether you’re reviewing performance by supplier, assessing seasonal carryover, or planning future buys, this report helps you keep a firm handle on the financial health of your inventory.
Top Customers Report
The Top Customers Report identifies your highest-value customers based on total sales within a chosen date range. It’s a quick way to see who is driving the most revenue and profit for your business, and to spot purchasing patterns worth acting on.
You can filter the report by Customer Type (such as Retail or Trade) or Sales Channel (for example, Website, Store, or Marketplace) to focus on the relationships most relevant to your goals.
The report includes key details such as the number of orders placed, total sales value, gross profit, and margin for each customer, along with the date and value of their most recent invoice (for B2B customers).
Armed with this information, you can shape more effective loyalty and retention strategies, reward your biggest spenders, and tailor marketing efforts to the customers most likely to respond. Over time, this insight helps you strengthen your best relationships and grow their lifetime value.
Bestsellers Report
The Bestsellers Report highlights the products that have sold the most units within your chosen date range. It’s a faster way to identify top-performing products compared to running a General Sales Analysis, giving you quick access to what’s working best.
You simply select the date range you want to analyse, and the report lists each top-performing product with its sales quantity, total revenue, profit, and margin. It also includes the most recent purchase date, helping you plan restocking schedules.
By understanding which products are performing best, you can make informed decisions on inventory purchasing, marketing campaigns, and product placement across your sales channels, ensuring you maximise the return on proven winners.
Payment Receipts
The Payment Receipts by Payment Type Breakdown Report gives you a detailed view of your payment transactions, including individual Customers, Orders, and the amounts they’ve paid.
It’s a quicker way to understand how your Customers are paying compared to pulling separate sales and payment reports, giving you clear insight into payment trends.
You simply choose the date range, select the Payment Type(s) you want to analyse, and optionally filter by sales channel. The report then lists each transaction with the Customer name and number, Order number, Payment Type, amounts in the original currency and converted to GBP, exchange rates, and the associated delivery method.
By reviewing this report, you can spot customer payment preferences, monitor transaction patterns, and use the insights to support financial forecasting, reconciliation, and even inform decisions about which payment options to promote across your sales channels.
Final thoughts
With hundreds of reports available in Venditan Commerce you can dig as deep as you need into your business data.
If you want to enable additional reports, create new custom reports, or explore more ways to analyse your sales, speak to your account manager or contact us today. Our team can help you get the insights you need to make smarter, faster business decisions.
Our recent posts
Keep up to date with the latest news and insight from the team at Venditan


-p-2600.webp)
.webp)